A sensor may need only a few milliamps, yet its supply can still spoil an experiment. Three alkaline cells do not remain at a fixed voltage. A power indicator can consume more current than a sleeping sensor. A capacitor that looks optional on a breadboard can be part of the regulator’s control loop. This project makes those effects visible with a small 3.3 V supply and three known loads.
We use a low-dropout regulator (LDO): a linear regulator that controls a series transistor to hold its output near a chosen voltage while needing a relatively small input-to-output difference. The chip is the Microchip MCP1700-3302E/TO, a fixed 3.3 V version in a three-lead TO-92 package. Build it first as a power experiment. Its resistors stand in for a low-current sensor, so an unknown board cannot hide the explanation behind unpredictable current bursts.
The exact parts and the small job they perform
The order code matters. 330 selects nominal 3.3 V; the following 2 is the standard tolerance option, E is the extended temperature grade, and /TO is the TO-92 package. These letters do not make every MCP1700 package share a pin order. The current Microchip product page links data sheet DS20001826F, revision F, December 2020; its identification table explicitly lists this order code. The product documentation and a targeted errata search were checked on October 16, 2026. No separate MCP1700 errata document was located in that review; check the product page again before ordering a substituted part.
| Reference | Part or value | Purpose |
|---|---|---|
| U1 | Microchip MCP1700-3302E/TO, TO-92 | Fixed 3.3 V regulator; verify the full label. |
| C1, C2 | TDK C3225X7R1H475K250AB, 4.7 µF, 50 V, ±10%, X7R, 1210; two parts on short labelled adapters | Local input and output capacitors. The output capacitor is required. |
| R1 | 33 kΩ, ±1%, at least 0.125 W | Permanent nominal 100 µA test load. |
| R2, S1 | 3.3 kΩ, ±1%, at least 0.125 W; on/off switch | Add a nominal 1 mA branch. |
| R3, S2 | 330 Ω, ±1%, at least 0.125 W; on/off switch | Add a nominal 10 mA branch. |
| BT1, S0 | Three-AA holder, three matched fresh Energizer E91 alkaline cells; on/off switch | Nominal 4.5 V source after the supply test. Primary cells only; no charging connection. |
| TP1–TP3 | Insulated test points, board and short wires | Measure VIN, VOUT and the shared ground without slipping between leads. |
| Instruments | Multimeter; adjustable 2.8–5.0 V bench supply with current limit; optional oscilloscope | The supply makes the dropout sweep repeatable. A scope can reveal disturbances a meter averages. |
A microamp (µA) is one millionth of an amp; 1000 µA equals one milliamp (mA). A microfarad (µF) is the capacitance unit used here. The capacitor’s 1210 package has a body about 3.2 × 2.5 mm: the size code describes the physical part, not its capacitance.
X7R names a ceramic dielectric temperature class; it is not a promise of constant capacitance when direct current voltage is applied. Direct current (DC) here means the supply has a fixed polarity. The selected TDK part has a generous nominal capacitance and voltage rating; its published DC-bias and equivalent-series-resistance curves support this low-voltage choice. Those curves are reference characteristics, not a guaranteed lower bound for every sample. Retain at least 1 µF effective output capacitance under actual voltage, tolerance, ageing and temperature, and check the assembled supply if changing capacitor type or layout. The 1210 chips need a small soldered adapter or board; do not push bare surface-mount parts into breadboard holes.
Read the pin numbers before connecting the cells
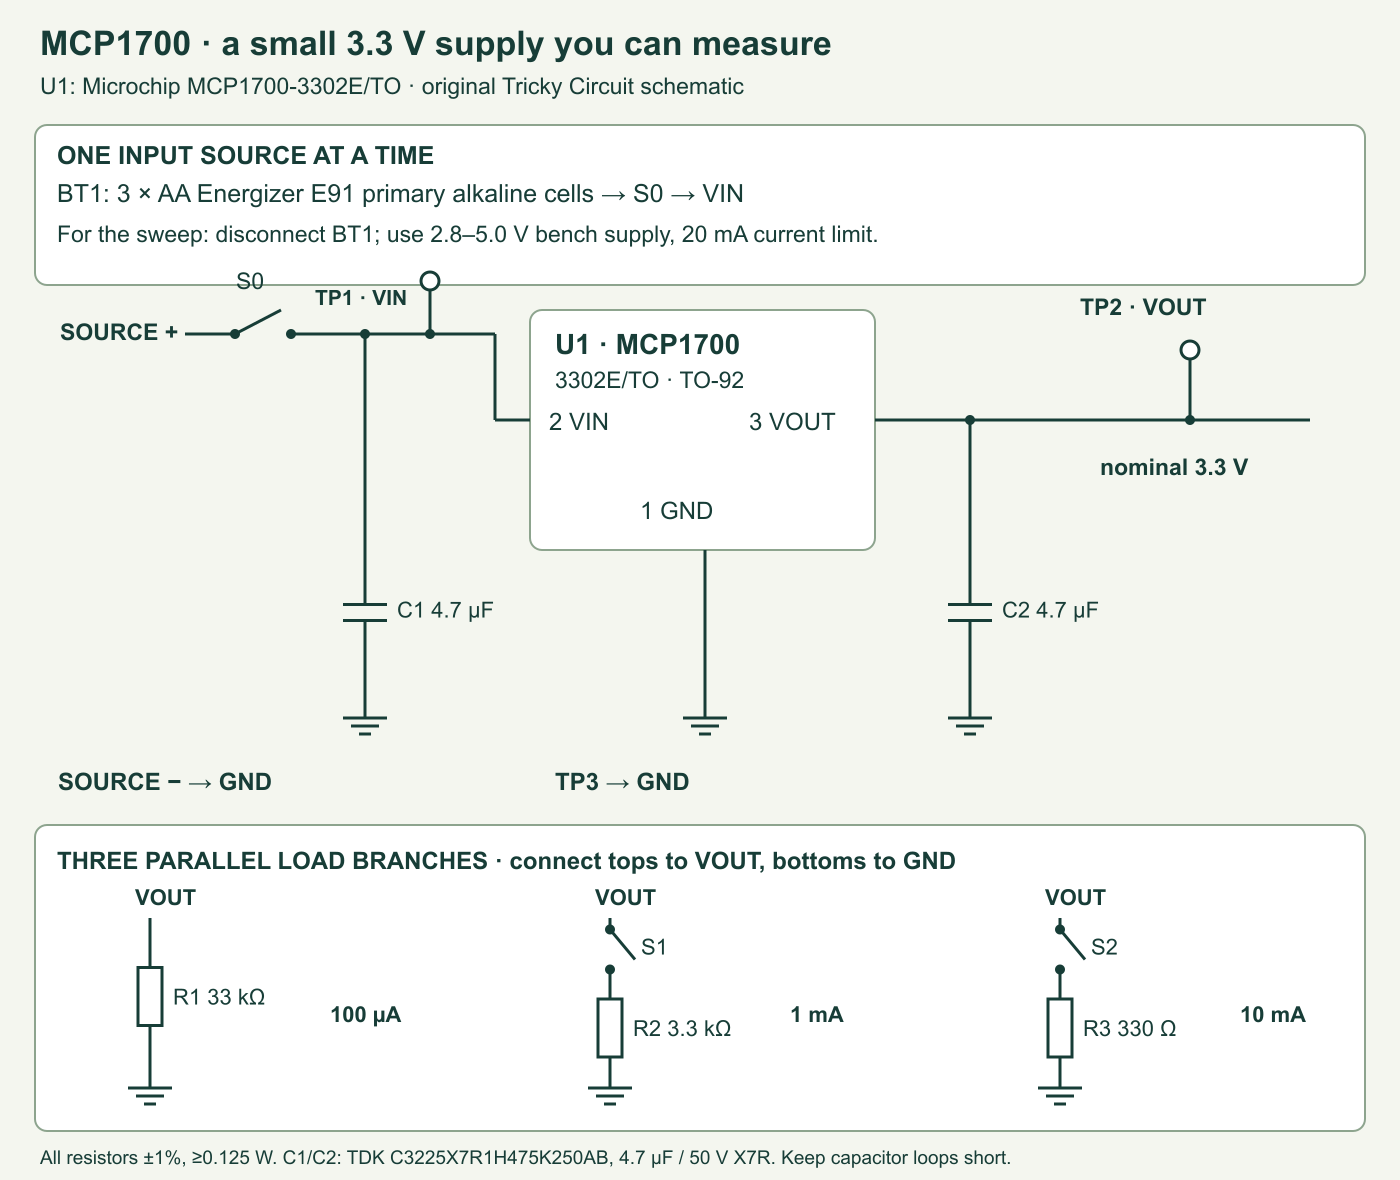
With the flat marked face toward you and the three leads pointing down, the data sheet’s TO-92 drawing shows pin 1 at left: GND; pin 2 in the middle: VIN; pin 3 at right: VOUT. Ground, abbreviated GND, is our common zero-volt return. VIN means input voltage and VOUT means output voltage. Check the package drawing rather than copying the pinout of a transistor or another three-terminal regulator.
- Connect U1 pin 1 to the ground rail. Connect battery negative, C1’s ground end, C2’s ground end and every load return to that same rail.
- Connect the selected source positive through S0 to U1 pin 2. Connect C1 directly between pins 2 and 1, with a short loop.
- Connect U1 pin 3 to the output rail. Connect C2 directly between pins 3 and 1. These ceramic capacitors have no positive or negative orientation.
- Fit R1 from output to ground. Add a second branch from output through S1 and R2 to ground, and a third through S2 and R3 to ground. The switches open only their own resistor branches.
- Label TP1 as VIN, TP2 as VOUT and TP3 as GND. Check for an output-to-ground short before inserting U1 or applying power.
For the first test, leave the holder completely disconnected and connect the bench supply at the source terminals instead. Do not connect both sources together. After the sweep, switch off and remove both bench leads before connecting the holder. The drawing has no reverse-polarity protection: the holder and a polarity check are part of the assembly procedure. Adding a protection diode later consumes headroom and requires repeating the input measurements at pin 2.
Place C1 and C2 near U1, not at the far end of long power rails. Equivalent series resistance (ESR) is the resistive part of a real capacitor’s impedance. The MCP1700 data sheet allows output-capacitor ESR from 0 to 2 Ω and requires at least 1 µF for stability. A distant capacitor plus long wiring is not the same connection as a local capacitor. Do not deliberately remove C2 while powered to create a fault: it would replace a controlled experiment with an unspecified operating condition.
The useful input window is narrower than “2.3 to 6 volts”
The chip’s input operating range is 2.3–6.0 V. Its 6.5 V absolute maximum is a damage-related stress limit, not a usable supply setting. Our project deliberately uses 2.8–5.0 V during the sweep and a measured three-cell alkaline pack afterward. Two cells cannot maintain a 3.3 V output as they discharge, and this regulator cannot raise voltage. Never connect a rectangular 9 V battery to this design.
Dropout is the region where the regulator has insufficient input headroom to maintain its regulated output. Microchip defines its dropout test at an output 2% below the value measured with a one-volt input margin. The table gives a maximum 350 mV input-output difference at 250 mA for output versions above 2.5 V. The often-quoted 178 mV typical figure is specified at 250 mA for a 2.8 V version; it is not an exact threshold for this 3.3 V, 11 mA experiment.
The data sheet’s input note includes the nominal voltage plus 3% and the applicable dropout. Using the listed maximum as a conservative headroom screen gives:
3.3 V × 1.03 + 0.350 V = 3.749 V
At VIN = 4.50 V: screen margin = 0.751 V
At VIN = 3.60 V: screen margin = −0.149 V
This screen is a design check, not a predicted low-current knee or a complete combined output-error guarantee. The lighter load will often remain regulated below that screen; measure it. At 2.8 V input, a 3.3 V output is impossible without another source. That observation is expected and does not prove the chip is broken.
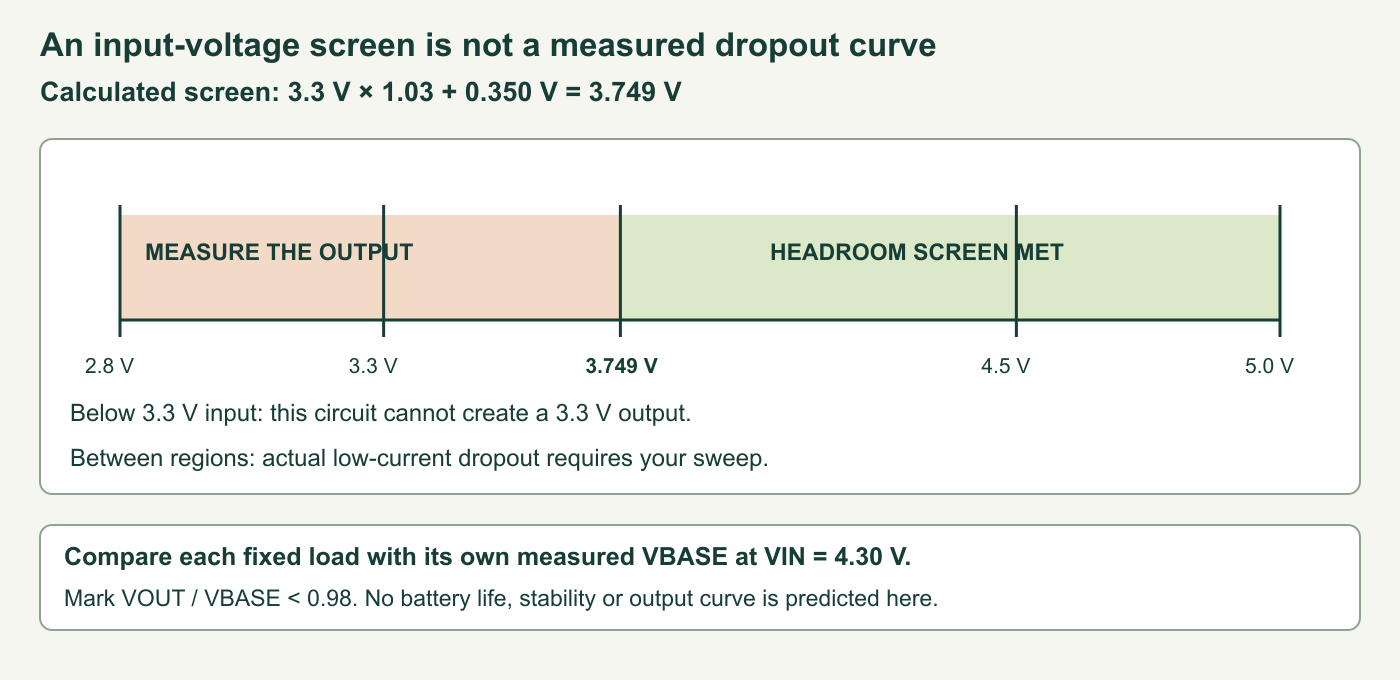
The 3.3 V version’s initial output tolerance is ±2% at the table’s reference conditions, while the temperature-range row is ±3%. Thus 3.234–3.366 V is a useful room-temperature reference-condition interval, not a blanket acceptance band for every voltage, load and temperature. Line regulation, load regulation, thermal effects and measurement error have their own conditions. Keep your measured high-input baseline so that the dropout experiment is not confused with initial tolerance.
Known loads make current and heat explainable
Ohm’s law relates a resistor’s voltage, current and resistance: I = V/R. At an assumed 3.300 V output, R1 draws 100 µA. Closing S1 adds 1.000 mA; closing S2 adds 10.000 mA. All three branches together draw 11.100 mA. These are nominal calculations. Calculate actual branch current from the measured output and the measured resistor value if greater accuracy matters.
R1: 3.3 / 33000 = 0.000100 A
R2: 3.3 / 3300  = 0.001000 A
R3: 3.3 / 330   = 0.010000 A
Total, S1 + S2 closed = 0.011100 A
R3 power: 3.3² / 330 = 0.0330 W
With the output at 3.399 V and a 330 Ω resistor 1% low, R3 dissipates about 35.4 mW, comfortably below its 125 mW rating. The “3.399 V” value is simply nominal plus 3% used for this resistor-power calculation; it does not combine all supply errors into an overall guarantee. Power is heat per unit time, measured in watts. Leave space around resistors and do not replace R3 with a lower value to chase the regulator’s headline current rating.
The regulator itself dissipates approximately (VIN − VOUT) × ILOAD plus VIN × IGND. At 4.5 V, 3.3 V and 11.1 mA, the main term is 13.32 mW; at 5.0 V it is 18.87 mW. Microchip’s thermal table gives 92 °C/W for TO-92 under its specified board test conditions. Multiplying gives roughly 1.7 °C rise for that 18.87 mW example, but a breadboard, enclosure and airflow are different thermal systems. Use this as a scale check, not a temperature measurement.
The chip can supply up to 250 mA for this output-voltage family when its electrical and thermal conditions permit. At 5.0 V input, 3.3 V output and 250 mA, the main dissipation becomes 425 mW. A package-current number therefore does not approve an arbitrary 250 mA load, and thermal shutdown is a last-resort protection rather than a way to control normal temperature. Microchip’s AN761 thermal note explains why voltage and current limits must be considered together.
Three bench experiments, with a record you can compare
Experiment 1: regulation under a known load. With the holder absent, set the supply to 4.50 V and its current limit to 20 mA. Start with S1 and S2 open. Apply power and measure at TP1 and TP2 relative to TP3. Record the actual input, output and switch state. Close S1, then S2; finally close both. The output should remain near its regulated level if wiring, input and capacitors are sound. The calculated load changes to 1.1, 10.1 and 11.1 mA respectively. If the supply remains in current limit after startup or U1 warms noticeably at these loads, switch off and inspect the pinout and rails.
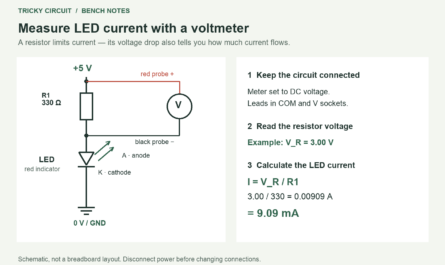
Measure voltage across each resistor rather than putting a meter’s current terminals directly across the supply. A meter in current mode behaves very differently from a voltage measurement. Its burden voltage—the voltage lost inside its current range—can also change a low-headroom measurement. Voltage across a known resistor is enough to establish our load without inserting that additional series error.
Experiment 2: find a measured dropout region. Keep one switch configuration fixed, preferably both closed. At 4.30 V input, record its output as VBASE. Reduce the supply slowly through 4.0, 3.8, 3.7, 3.6, 3.5, 3.4, 3.3, 3.1 and 2.8 V; measure the voltage actually reaching TP1 at every step. Wait for stable readings. Around a transition, repeat with smaller steps. Mark where output first falls below 0.98 × VBASE. Restore 4.30 V and confirm recovery. Repeat for R1 alone with a new baseline; do not compare different loads to a single baseline.
| Load switches | Measured VIN | Measured VOUT | VOUT / VBASE | Observation |
|---|---|---|---|---|
| Both closed | 4.30 V target | Record VBASE | 1.000 by definition | Supply not current-limited |
| Same | Record each step | Measure | Calculate | Above/below 98%; recovery? |
A slow meter sweep does not certify transient performance or noise. If an oscilloscope is available, use a short ground connection and inspect the output while changing S2. Keep the source and ground arrangement identical for both loads. Record time scale, probe settings and the minimum observed output. Do not label a brief switching spike as the steady dropout threshold, and do not infer an absence of oscillation from a meter that displays a steady average.
Experiment 3: replace the supply with three cells. Switch off, unplug the bench leads, and measure the holder’s polarity and voltage before connecting it through S0. Use three matched E91 primary alkaline cells. Their nominal total is 4.5 V, not a promise of constant loaded voltage. Repeat the load table, including voltage at TP1 while both switches are closed. The cell manufacturer’s discharge charts depend on load and endpoint. A capacity quoted down to 0.8 V per cell cannot be divided by our load to promise the time for which this supply will remain at 3.3 V: three cells at that endpoint provide only 2.4 V.
Why a permanent power LED changes the low-current result
Quiescent current is current consumed by the regulator’s own circuitry with no external load. The MCP1700 table lists 1.6 µA typical and 4 µA maximum under its no-load test conditions. The ground current can change with output load and dropout. Consequently, 1.6 µA is not a guaranteed subtraction from every battery measurement, and our permanent 33 kΩ branch means this assembled experiment is never a no-load test.
A hypothetical 1 mA power indicator draws ten times R1’s 100 µA baseline and about 625 times the quoted typical no-load quiescent current. That is why the main circuit has no power LED. To investigate quiescent current separately, remove the load branches with power off, keep C1 and C2 fitted, and use an appropriately fused low-current meter in series with the input. Begin on a range that can tolerate capacitor charging current, then select a suitable range. Record the meter’s burden voltage and the actual VIN. Leakage, dirty boards and instrument resolution may dominate a few microamps; an unstable last digit is not a device specification.
For a first efficiency estimate in regulation, output current and input current are nearly equal, so efficiency is roughly VOUT/VIN: about 73.3% at 4.5 V and 66.0% at 5.0 V before ground-current effects. A switching converter may use the voltage difference differently, but has its own idle current, ripple and load limits. Choose between them from the real duty cycle and measured supply behavior. This small linear design teaches a quiet low-current rail; it is not a universal supply for radios, motors, Raspberry Pi computers or charging cells.
Optional complete host calculator
This Python 3 program performs the displayed arithmetic. It does not simulate the regulator control loop, capacitor stability, battery discharge or temperature. Supply a measured output with --vout when analysing a sweep. The default 1.6 µA ground current is explicitly an illustrative no-load assumption; replace it with a relevant measurement rather than treating it as a bound under load. A negative headroom screen margin reports missing design margin and still does not predict the measured output.
python3 mcp1700_budget.py --vin 4.5 --step1 --step2
python3 mcp1700_budget.py --vin 3.4 --vout 3.20 --baseline 3.30 --step1 --step2
"""MCP1700 bench arithmetic, not an electrical or battery-life simulation.
Run: python3 mcp1700_budget.py --vin 4.5 --step1 --step2
Use --vout with a measured steady voltage; --baseline compares a sweep point.
"""
import argparse
import json
import math
RESISTORS = (33000.0, 3300.0, 330.0)
PIN_FUNCTIONS = {1: "GND", 2: "VIN", 3: "VOUT"}
def finite_number(value, name, low=0.0, high=None, inclusive_low=True):
value = float(value)
if not math.isfinite(value):
raise ValueError(name + " must be finite")
if value < low or (not inclusive_low and value == low):
raise ValueError(name + " is below the allowed range")
if high is not None and value > high:
raise ValueError(name + " is above the allowed range")
return value
def headroom_screen(nominal=3.3, tolerance=0.03, dropout=0.350):
"""Datasheet-note arithmetic; not a predicted low-current dropout knee."""
nominal = finite_number(nominal, "nominal", inclusive_low=False)
tolerance = finite_number(tolerance, "tolerance", high=1.0)
dropout = finite_number(dropout, "dropout")
return max(2.3, nominal * (1.0 + tolerance) + dropout)
def loads(vout=3.3, step1=False, step2=False, resistance_scale=1.0):
"""Exact Ohm-law arithmetic for the three fitted resistive branches."""
vout = finite_number(vout, "vout", high=3.6)
scale = finite_number(resistance_scale, "resistance_scale", inclusive_low=False)
active = (True, bool(step1), bool(step2))
branches = []
for reference, nominal, on in zip(("R1", "R2", "R3"), RESISTORS, active):
resistance = nominal * scale
branches.append({"reference": reference, "active": on,
"resistance_ohm": resistance,
"current_A": vout / resistance if on else 0.0,
"power_W": vout * vout / resistance if on else 0.0})
return branches
def budget(vin, vout=3.3, step1=False, step2=False, ground_current=1.6e-6,
resistance_scale=1.0):
"""Power accounting for a measured/assumed output, not regulator prediction.
The 1.6 uA default is an illustration taken from the NO-LOAD typical spec.
Supply ground current under load must be measured; it is not bounded here.
"""
vin = finite_number(vin, "vin", low=2.3, high=5.0)
vout = finite_number(vout, "vout", high=3.6)
if vout > vin:
raise ValueError("this forward-powered experiment requires vout <= vin")
ground_current = finite_number(ground_current, "ground_current")
branches = loads(vout, step1, step2, resistance_scale)
load_current = sum(x["current_A"] for x in branches)
input_current = load_current + ground_current
pin = vin * input_current
pout = vout * load_current
return {"vin_V": vin, "vout_V": vout, "branches": branches,
"load_current_A": load_current, "input_current_A": input_current,
"load_power_W": pout, "regulator_power_W": pin - pout,
"efficiency": pout / pin if pin else None,
"headroom_screen_V": headroom_screen(),
"screen_margin_V": vin - headroom_screen(),
"ground_current_is_user_assumption": True}
def compare_to_baseline(vout, baseline):
"""Compare the same device/load to its own high-input measurement."""
baseline = finite_number(baseline, "baseline", high=3.6, inclusive_low=False)
vout = finite_number(vout, "vout", high=3.6)
ratio = vout / baseline
return {"relative_output": ratio, "loss_percent": 100.0 * (1.0 - ratio),
"below_98_percent": ratio < 0.98}
def main():
parser = argparse.ArgumentParser(description=__doc__)
parser.add_argument("--vin", type=float, required=True)
parser.add_argument("--vout", type=float, default=3.3)
parser.add_argument("--step1", action="store_true")
parser.add_argument("--step2", action="store_true")
parser.add_argument("--ground-uA", type=float, default=1.6)
parser.add_argument("--baseline", type=float)
args = parser.parse_args()
try:
result = budget(args.vin, args.vout, args.step1, args.step2,
args.ground_uA * 1e-6)
if args.baseline is not None:
result["sweep_comparison"] = compare_to_baseline(args.vout, args.baseline)
except ValueError as error:
parser.error(str(error))
print(json.dumps(result, indent=2, allow_nan=False))
if __name__ == "__main__":
main()
The second command compares 3.20 V with a 3.30 V baseline: a 3.03% loss, below the 98% marker. Those command values are an example input, not a measured result. The program rejects non-finite numbers, reverse-powered values and input voltages outside this experiment’s 2.3–5.0 V calculation envelope. Its tests exercise both CLI error handling and power accounting; passing them says nothing about a physical assembly.
Interpret a failed reading before adding a sensor
- Output follows the input downward: first measure VIN at pin 2. A discharging pack, resistive switch or lead drop can remove headroom even when the unloaded holder looked healthy.
- Output is near the input at 4.5 V: switch off. Recheck package orientation, accidental VIN-to-VOUT bridging and the exact order code before connecting a 3.3 V device.
- Output collapses only on S2: check supply current limiting, R3’s colour bands, common ground and breadboard contact resistance. Compare the actual VIN during the collapse.
- Average voltage looks plausible but a sensor later resets: check startup and transient voltage with a suitable instrument; test the sensor’s peak current, local decoupling and valid supply range.
- Unexpected input current: account for every resistor, indicator, adapter and externally connected signal. A separately powered controller can feed a switched-off sensor through an input pin. Disconnect it during this standalone experiment.
A future sensor connection replaces the dummy loads only after its voltage range and current profile have been checked. Remove R2 and R3 if they are no longer part of the test; retaining them wastes energy. The remaining 33 kΩ branch is also a deliberate test load, not an essential regulator support part. Use a shared reference only where the actual signal interface requires one, and prevent the sensor from being powered through a data line while its supply is off.
Challenge: is a low battery reading proof of a bad regulator?
Your supply reads 3.55 V at TP1 and 3.28 V at TP2 with both load switches closed. At 4.30 V input, the same load previously gave 3.31 V. Has the experiment already crossed our 2% output-loss marker? Does it meet the conservative headroom screen? Calculate the 330 Ω branch current from the measured output.
Show the reasoning
The ratio is 3.28/3.31 ≈ 0.99094, a loss of about 0.91%, so it has not crossed the 98% marker. However, 3.55 V is 0.199 V below the conservative 3.749 V screen. A sample can produce a plausible result without meeting that design-margin check. The 330 Ω branch draws approximately 3.28/330 = 9.94 mA. Keep measuring as input falls; neither this single result nor the screen identifies the complete transfer curve or predicts battery life.
Sources and useful next experiments
Continue with the Tricky Circuit lessons and the loaded voltage-divider experiment. A divider is a useful contrast because its output changes with load even while its input remains fixed. Keep the same careful distinction between a calculated value and a measured result.
- Microchip MCP1700 product page and current document list.
- Microchip DS20001826F: package drawing, electrical-characteristic conditions, pin functions and capacitor requirements; sections 1, 3, 5 and 6.
- Microchip AN761: LDO Thermal Considerations.
- TDK capacitor product specification and reference characteristic sheet; capacitor curves do not guarantee assembled-system stability.
- Energizer E91 product data, E91NA0323: alkaline-cell identity and load-dependent discharge examples.
Download the source package (ZIP): complete programs, full-size PNG and editable SVG diagrams, and the logger’s host tests. The same complete article program is included above.